A study with low statistical power has a reduced chance of detecting a true effect, but it is less well appreciated that low power also reduces the likelihood that a statistically significant result reflects a true effect. Here, we show that the average statistical power of studies in the neurosciences is very low. The consequences of this include overestimates of effect size and low reproducibility of results. There are also ethical dimensions to this problem, as unreliable research is inefficient and wasteful. Improving reproducibility in neuroscience is a key priority and requires attention to well-established but often ignored methodological principles.
Here, we focus on one major aspect of the problem: low statistical power. The relationship between study power and the veracity of the resulting finding is under-appreciated. Low statistical power (because of low sample size of studies, small effects or both) negatively affects the likelihood that a nominally statistically significant finding actually reflects a true effect. We discuss the problems that arise when low-powered research designs are pervasive. In general, these problems can be divided into two categories. The first concerns problems that are mathematically expected to arise even if the research conducted is otherwise perfect: in other words, when there are no biases that tend to create statistically significant (that is, 'positive') results that are spurious. The second category concerns problems that reflect biases that tend to co-occur with studies of low power or that become worse in small, underpowered studies. We next empirically show that statistical power is typically low in the field of neuroscience by using evidence from a range of subfields within the neuroscience literature. We illustrate that low statistical power is an endemic problem in neuroscience and discuss the implications of this for interpreting the results of individual studies.
Low power in the absence of other biases
Three main problems contribute to producing unreliable findings in studies with low power, even when all other research practices are ideal. They are: the low probability of finding true effects; the low positive predictive value (PPV; see Box 1 for definitions of key statistical terms) when an effect is claimed; and an exaggerated estimate of the magnitude of the effect when a true effect is discovered. Here, we discuss these problems in more detail.
First, low power, by definition, means that the chance of discovering effects that are genuinely true is low. That is, low-powered studies produce more false negatives than high-powered studies. When studies in a given field are designed with a power of 20%, it means that if there are 100 genuine non-null effects to be discovered in that field, these studies are expected to discover only 20 of them 11 .
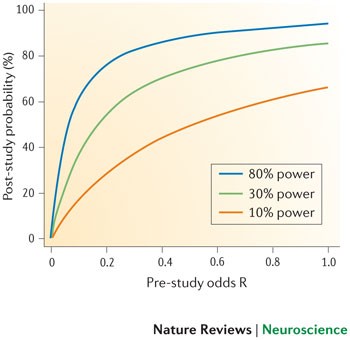
Second, the lower the power of a study, the lower the probability that an observed effect that passes the required threshold of claiming its discovery (that is, reaching nominal statistical significance, such as p < 0.05) actually reflects a true effect 1,12 . This probability is called the PPV of a claimed discovery. The formula linking the PPV to power is:
where (1 − β) is the power, β is the type II error, α is the type I error and R is the pre-study odds (that is, the odds that a probed effect is indeed non-null among the effects being probed). The formula is derived from a simple two-by-two table that tabulates the presence and non-presence of a non-null effect against significant and non-significant research findings 1 . The formula shows that, for studies with a given pre-study odds R, the lower the power and the higher the type I error, the lower the PPV. And for studies with a given pre-study odds R and a given type I error (for example, the traditional p = 0.05 threshold), the lower the power, the lower the PPV.
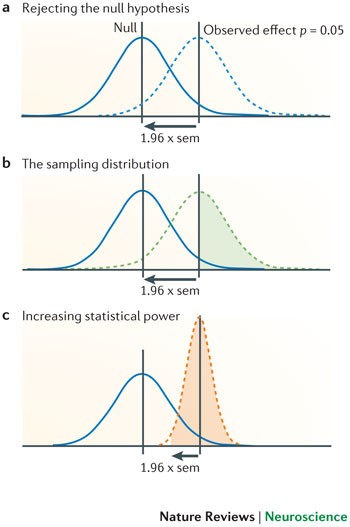
The winner's curse can also affect the design and conclusions of replication studies. If the original estimate of the effect is inflated (for example, an odds ratio of 1.60), then replication studies will tend to show smaller effect sizes (for example, 1.20), as findings converge on the true effect. By performing more replication studies, we should eventually arrive at the more accurate odds ratio of 1.20, but this may take time or may never happen if we only perform small studies. A common misconception is that a replication study will have sufficient power to replicate an initial finding if the sample size is similar to that in the original study 14 . However, a study that tries to replicate a significant effect that only barely achieved nominal statistical significance (that is, p ∼ 0.05) and that uses the same sample size as the original study, will only achieve ∼ 50% power, even if the original study accurately estimated the true effect size. This is illustrated in Fig. 1. Many published studies only barely achieve nominal statistical significance 15 . This means that if researchers in a particular field determine their sample sizes by historical precedent rather than through formal power calculation, this will place an upper limit on average power within that field. As the true effect size is likely to be smaller than that indicated by the initial study — for example, because of the winner's curse — the actual power is likely to be much lower. Furthermore, even if power calculation is used to estimate the sample size that is necessary in a replication study, these calculations will be overly optimistic if they are based on estimates of the true effect size that are inflated owing to the winner's curse phenomenon. This will further hamper the replication process.
Low power in the presence of other biases
Low power is associated with several additional biases. First, low-powered studies are more likely to provide a wide range of estimates of the magnitude of an effect (which is known as 'vibration of effects' and is described below). Second, publication bias, selective data analysis and selective reporting of outcomes are more likely to affect low-powered studies. Third, small studies may be of lower quality in other aspects of their design as well. These factors can further exacerbate the low reliability of evidence obtained in studies with low statistical power.
Vibration of effects 13 refers to the situation in which a study obtains different estimates of the magnitude of the effect depending on the analytical options it implements. These options could include the statistical model, the definition of the variables of interest, the use (or not) of adjustments for certain potential confounders but not others, the use of filters to include or exclude specific observations and so on. For example, a recent analysis of 241 functional MRI (fMRI) studies showed that 223 unique analysis strategies were observed so that almost no strategy occurred more than once 16 . Results can vary markedly depending on the analysis strategy 1 . This is more often the case for small studies — here, results can change easily as a result of even minor analytical manipulations. In small studies, the range of results that can be obtained owing to vibration of effects is wider than in larger studies, because the results are more uncertain and therefore fluctuate more in response to analytical changes. Imagine, for example, dropping three observations from the analysis of a study of 12 samples because post-hoc they are considered unsatisfactory; this manipulation may not even be mentioned in the published paper, which may simply report that only nine patients were studied. A manipulation affecting only three observations could change the odds ratio from 1.00 to 1.50 in a small study but might only change it from 1.00 to 1.01 in a very large study. When investigators select the most favourable, interesting, significant or promising results among a wide spectrum of estimates of effect magnitudes, this is inevitably a biased choice.
Publication bias and selective reporting of outcomes and analyses are also more likely to affect smaller, underpowered studies 17 . Indeed, investigations into publication bias often examine whether small studies yield different results than larger ones 18 . Smaller studies more readily disappear into a file drawer than very large studies that are widely known and visible, and the results of which are eagerly anticipated (although this correlation is far from perfect). A 'negative' result in a high-powered study cannot be explained away as being due to low power 19,20 , and thus reviewers and editors may be more willing to publish it, whereas they more easily reject a small 'negative' study as being inconclusive or uninformative 21 . The protocols of large studies are also more likely to have been registered or otherwise made publicly available, so that deviations in the analysis plans and choice of outcomes may become obvious more easily. Small studies, conversely, are often subject to a higher level of exploration of their results and selective reporting thereof.
Third, smaller studies may have a worse design quality than larger studies. Several small studies may be opportunistic experiments, or the data collection and analysis may have been conducted with little planning. Conversely, large studies often require more funding and personnel resources. As a consequence, designs are examined more carefully before data collection, and analysis and reporting may be more structured. This relationship is not absolute — small studies are not always of low quality. Indeed, a bias in favour of small studies may occur if the small studies are meticulously designed and collect high-quality data (and therefore are forced to be small) and if large studies ignore or drop quality checks in an effort to include as large a sample as possible.
Empirical evidence from neuroscience
Any attempt to establish the average statistical power in neuroscience is hampered by the problem that the true effect sizes are not known. One solution to this problem is to use data from meta-analyses. Meta-analysis provides the best estimate of the true effect size, albeit with limitations, including the limitation that the individual studies that contribute to a meta-analysis are themselves subject to the problems described above. If anything, summary effects from meta-analyses, including power estimates calculated from meta-analysis results, may also be modestly inflated 22 .
Acknowledging this caveat, in order to estimate statistical power in neuroscience, we examined neuroscience meta-analyses published in 2011 that were retrieved using 'neuroscience' and 'meta-analysis' as search terms. Using the reported summary effects of the meta-analyses as the estimate of the true effects, we calculated the power of each individual study to detect the effect indicated by the corresponding meta-analysis.
Methods. Included in our analysis were articles published in 2011 that described at least one meta-analysis of previously published studies in neuroscience with a summary effect estimate (mean difference or odds/risk ratio) as well as study level data on group sample size and, for odds/risk ratios, the number of events in the control group.
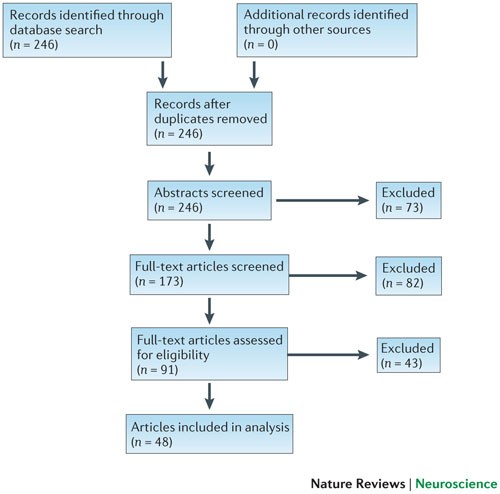
We searched computerized databases on 2 February 2012 via Web of Science for articles published in 2011, using the key words 'neuroscience' and 'meta-analysis'. All of the articles that were identified via this electronic search were screened independently for suitability by two authors (K.S.B. and M.R.M.). Articles were excluded if no abstract was electronically available (for example, conference proceedings and commentaries) or if both authors agreed, on the basis of the abstract, that a meta-analysis had not been conducted. Full texts were obtained for the remaining articles and again independently assessed for eligibility by two authors (K.S.B. and M.R.M.) (Fig. 2).
Data were extracted from forest plots, tables and text. Some articles reported several meta-analyses. In those cases, we included multiple meta-analyses only if they contained distinct study samples. If several meta-analyses had overlapping study samples, we selected the most comprehensive (that is, the one containing the most studies) or, if the number of studies was equal, the first analysis presented in the article. Data extraction was independently performed by K.S.B. and either M.R.M. or C.M. and verified collaboratively.
The following data were extracted for each meta-analysis: first author and summary effect size estimate of the meta-analysis; and first author, publication year, sample size (by groups), number of events in the control group (for odds/risk ratios) and nominal significance (p < 0.05, 'yes/no') of the contributing studies. For five articles, nominal study significance was unavailable and was therefore obtained from the original studies if they were electronically available. Studies with missing data (for example, due to unclear reporting) were excluded from the analysis.
The main outcome measure of our analysis was the achieved power of each individual study to detect the estimated summary effect reported in the corresponding meta-analysis to which it contributed, assuming an α level of 5%. Power was calculated using G * Power software 23 . We then calculated the mean and median statistical power across all studies.
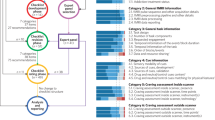
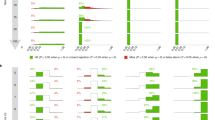
Results. Our search strategy identified 246 articles published in 2011, out of which 155 were excluded after an initial screening of either the abstract or the full text. Of the remaining 91 articles, 48 were eligible for inclusion in our analysis 24,25,26,27,28,29,30,31,32,33,34,35,36,37,38,39,40,41,42,43,44,45,46,47,48,49,50,51,52,53,54,55,56,57,58,59,60,61,62,63,64,65,66,67,68,69,70,71 , comprising data from 49 meta-analyses and 730 individual primary studies. A flow chart of the article selection process is shown in Fig. 2, and the characteristics of included meta-analyses are described in Table 1.
Small sample sizes are appropriate if the true effects being estimated are genuinely large enough to be reliably observed in such samples. However, as small studies are particularly susceptible to inflated effect size estimates and publication bias, it is difficult to be confident in the evidence for a large effect if small studies are the sole source of that evidence. Moreover, many meta-analyses show small-study effects on asymmetry tests (that is, smaller studies have larger effect sizes than larger ones) but nevertheless use random-effect calculations, and this is known to inflate the estimate of summary effects (and thus also the power estimates). Therefore, our power calculations are likely to be extremely optimistic 76 .
Empirical evidence from specific fields
One limitation of our analysis is the under-representation of meta-analyses in particular subfields of neuroscience, such as research using neuroimaging and animal models. We therefore sought additional representative meta-analyses from these fields outside our 2011 sampling frame to determine whether a similar pattern of low statistical power would be observed.
Neuroimaging studies. Most structural and volumetric MRI studies are very small and have minimal power to detect differences between compared groups (for example, healthy people versus those with mental health diseases). A cl ear excess significance bias has been demonstrated in studies of brain volume abnormalities 73 , and similar problems appear to exist in fMRI studies of the blood-oxygen-level-dependent response 77 . In order to establish the average statistical power of studies of brain volume abnormalities, we applied the same analysis as described above to data that had been previously extracted to assess the presence of an excess of significance bias 73 . Our results indicated that the median statistical power of these studies was 8% across 461 individual studies contributing to 41 separate meta-analyses, which were drawn from eight articles that were published between 2006 and 2009. Full methodological details describing how studies were identified and selected are available elsewhere 73 .
Animal model studies. Previous analyses of studies using animal models have shown that small studies consistently give more favourable (that is, 'positive') results than larger studies 78 and that study quality is inversely related to effect size 79,80,81,82 . In order to examine the average power in neuroscience studies using animal models, we chose a representative meta-analysis that combined data from studies investigating sex differences in water maze performance (number of studies (k) = 19, summary effect size Cohen's d = 0.49) and radial maze performance (k = 21, summary effect size d = 0.69) 80 . The summary effect sizes in the two meta-analyses provide evidence for medium to large effects, with the male and female performance differing by 0.49 to 0.69 standard deviations for water maze and radial maze, respectively. Our results indicate that the median statistical power for the water maze studies and the radial maze studies to detect these medium to large effects was 18% and 31%, respectively (Table 2). The average sample size in these studies was 22 animals for the water maze and 24 for the radial maze experiments. Studies of this size can only detect very large effects (d = 1.20 for n = 22, and d = 1.26 for n = 24) with 80% power — far larger than those indicated by the meta-analyses. These animal model studies were therefore severely underpowered to detect the summary effects indicated by the meta-analyses. Furthermore, the summary effects are likely to be inflated estimates of the true effects, given the problems associated with small studies described above.
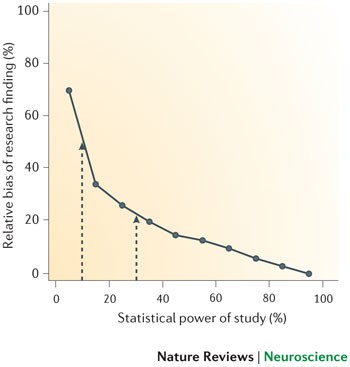
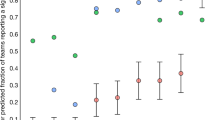
The estimates shown in Figs 4,5 are likely to be optimistic, however, because they assume that statistical power and R are the only considerations in determining the probability that a research finding reflects a true effect. As we have already discussed, several other biases are also likely to reduce the probability that a research finding reflects a true effect. Moreover, the summary effect size estimates that we used to determine the statistical power of individual studies are themselves likely to be inflated owing to bias — our excess of significance test provided clear evidence for this. Therefore, the average statistical power of studies in our analysis may in fact be even lower than the 8–31% range we observed.
Ethical implications. Low average power in neuroscience studies also has ethical implications. In our analysis of animal model studies, the average sample size of 22 animals for the water maze experiments was only sufficient to detect an effect size of d = 1.26 with 80% power, and the average sample size of 24 animals for the radial maze experiments was only sufficient to detect an effect size of d = 1.20. In order to achieve 80% power to detect, in a single study, the most probable true effects as indicated by the meta-analysis, a sample size of 134 animals would be required for the water maze experiment (assuming an effect size of d = 0.49) and 68 animals for the radial maze experiment (assuming an effect size of d = 0.69); to achieve 95% power, these sample sizes would need to increase to 220 and 112, respectively. What is particularly striking, however, is the inefficiency of a continued reliance on small sample sizes. Despite the apparently large numbers of animals required to achieve acceptable statistical power in these experiments, the total numbers of animals actually used in the studies contributing to the meta-analyses were even larger: 420 for the water maze experiments and 514 for the radial maze experiments.
There is ongoing debate regarding the appropriate balance to strike between using as few animals as possible in experiments and the need to obtain robust, reliable findings. We argue that it is important to appreciate the waste associated with an underpowered study — even a study that achieves only 80% power still presents a 20% possibility that the animals have been sacrificed without the study detecting the underlying true effect. If the average power in neuroscience animal model studies is between 20–30%, as we observed in our analysis above, the ethical implications are clear.
Low power therefore has an ethical dimension — unreliable research is inefficient and wasteful. This applies to both human and animal research. The principles of the 'three Rs' in animal research (reduce, refine and replace) 83 require appropriate experimental design and statistics — both too many and too few animals present an issue as they reduce the value of research outputs. A requirement for sample size and power calculation is included in the Animal Research: Reporting In Vivo Experiments (ARRIVE) guidelines 84 , but such calculations require a clear appreciation of the expected magnitude of effects being sought.
Of course, it is also wasteful to continue data collection once it is clear that the effect being sought does not exist or is too small to be of interest. That is, studies are not just wasteful when they stop too early, they are also wasteful when they stop too late. Planned, sequential analyses are sometimes used in large clinical trials when there is considerable expense or potential harm associated with testing participants. Clinical trials may be stopped prematurely in the case of serious adverse effects, clear beneficial effects (in which case it would be unethical to continue to allocate participants to a placebo condition) or if the interim effects are so unimpressive that any prospect of a positive result with the planned sample size is extremely unlikely 85 . Within a significance testing framework, such interim analyses — and the protocol for stopping — must be planned for the assumptions of significance testing to hold. Concerns have been raised as to whether stopping trials early is ever justified given the tendency for such a practice to produce inflated effect size estimates 86 . Furthermore, the decision process around stopping is not often fully disclosed, increasing the scope for researcher degrees of freedom 86 . Alternative approaches exist. For example, within a Bayesian framework, one can monitor the Bayes factor and simply stop testing when the evidence is conclusive or when resources are expended 87 . Similarly, adopting conservative priors can substantially reduce the likelihood of claiming that an effect exists when in fact it does not 85 . At present, significance testing remains the dominant framework within neuroscience, but the flexibility of alternative (for example, Bayesian) approaches means that they should be taken seriously by the field.
Conclusions and future directions
A consequence of the remarkable growth in neuroscience over the past 50 years has been that the effects we now seek in our experiments are often smaller and more subtle than before as opposed to when mostly easily discernible 'low-hanging fruit' were targeted. At the same time, computational analysis of very large datasets is now relatively straightforward, so that an enormous number of tests can be run in a short time on the same dataset. These dramatic advances in the flexibility of research design and analysis have occurred without accompanying changes to other aspects of research design, particularly power. For example, the average sample size has not changed substantially over time 88 despite the fact that neuroscientists are likely to be pursuing smaller effects. The increase in research flexibility and the complexity of study designs 89 combined with the stability of sample size and search for increasingly subtle effects has a disquieting consequence: a dramatic increase in the likelihood that statistically significant findings are spurious. This may be at the root of the recent replication failures in the preclinical literature 8 and the correspondingly poor translation of these findings into humans 90 .
Low power is a problem in practice because of the normative publishing standards for producing novel, significant, clean results and the ubiquity of null hypothesis significance testing as the means of evaluating the truth of research findings. As we have shown, these factors result in biases that are exacerbated by low power. Ultimately, these biases reduce the reproducibility of neuroscience findings and negatively affect the validity of the accumulated findings. Unfortunately, publishing and reporting practices are unlikely to change rapidly. Nonetheless, existing scientific practices can be improved with small changes or additions that approximate key features of the idealized model 4,91,92 . We provide a summary of recommendations for future research practice in Box 2.
Increasing disclosure. False positives occur more frequently and go unnoticed when degrees of freedom in data analysis and reporting are undisclosed 5 . Researchers can improve confidence in published reports by noting in the text: “We report how we determined our sample size, all data exclusions, all data manipulations, and all measures in the study.” 7 When such a statement is not possible, disclosure of the rationale and justification of deviations from what should be common practice (that is, reporting sample size, data exclusions, manipulations and measures) will improve readers' understanding and interpretation of the reported effects and, therefore, of what level of confidence in the reported effects is appropriate. In clinical trials, there is an increasing requirement to adhere to the Consolidated Standards of Reporting Trials (CONSORT), and the same is true for systematic reviews and meta-analyses, for which the Preferred Reporting Items for Systematic Reviews and Meta-Analyses (PRISMA) guidelines are now being adopted. A number of reporting guidelines have been produced for application to diverse study designs and tools, and an updated list is maintained by the EQUATOR Network 93 . A ten-item checklist of study quality has been developed by the Collaborative Approach to Meta-Analysis and Review of Animal Data in Experimental Stroke (CAMARADES), but to the best of our knowledge, this checklist is not yet widely used in primary studies.
Registration of confirmatory analysis plan. Both exploratory and confirmatory research strategies are legitimate and useful. However, presenting the result of an exploratory analysis as if it arose from a confirmatory test inflates the chance that the result is a false positive. In particular, p-values lose their diagnostic value if they are not the result of a pre-specified analysis plan for which all results are reported. Pre-registration — and, ultimately, full reporting of analysis plans — clarifies the distinction between confirmatory and exploratory analysis, encourages well-powered studies (at least in the case of confirmatory analyses) and reduces the file-drawer effect. These subsequently reduce the likelihood of false positive accumulation. The Open Science Framework (OSF) offers a registration mechanism for scientific research. For observational studies, it would be useful to register datasets in detail, so that one can be aware of how extensive the multiplicity and complexity of analyses can be 94 .
Improving availability of materials and data. Making research materials available will improve the quality of studies aimed at replicating and extending research findings. Making raw data available will improve data aggregation methods and confidence in reported results. There are multiple repositories for making data more widely available, such as The Dataverse Network Project and Dryad) for data in general and others such as OpenfMRI, INDI and OASIS for neuroimaging data in particular. Also, commercial repositories (for example, figshare) offer means for sharing data and other research materials. Finally, the OSF offers infrastructure for documenting, archiving and sharing data within collaborative teams and also making some or all of those research materials publicly available. Leading journals are increasingly adopting policies for making data, protocols and analytical codes available, at least for some types of studies. However, these policies are uncommonly adhered to 95 , and thus the ability for independent experts to repeat published analysis remains low 96 .
Incentivizing replication. Weak incentives for conducting and publishing replications are a threat to identifying false positives and accumulating precise estimates of research findings. There are many ways to alter replication incentives 97 . For example, journals could offer a submission option for registered replications of important research results (see, for example, a possible new submission format for Cortex 98 ). Groups of researchers can also collaborate on performing one or many replications to increase the total sample size (and therefore the statistical power) achieved while minimizing the labour and resource impact on any one contributor. Adoption of the gold standard of large-scale collaborative consortia and extensive replication in fields such as human genome epidemiology has transformed the reliability of the produced findings. Although previously almost all of the proposed candidate gene associations from small studies were false 99 (with some exceptions 100 ), collaborative consortia have substantially improved power, and the replicated results can be considered highly reliable. In another example, in the field of psychology, the Reproducibility Project is a collaboration of more than 100 researchers aiming to estimate the reproducibility of psychological science by replicating a large sample of studies published in 2008 in three psychology journals 92 . Each individual research study contributes just a small portion of time and effort, but the combined effect is substantial both for accumulating replications and for generating an empirical estimate of reproducibility.
Concluding remarks. Small, low-powered studies are endemic in neuroscience. Nevertheless, there are reasons to be optimistic. Some fields are confronting the problem of the poor reliability of research findings that arises from low-powered studies. For example, in genetic epidemiology sample sizes increased dramatically with the widespread understanding that the effects being sought are likely to be extremely small. This, together with an increasing requirement for strong statistical evidence and independent replication, has resulted in far more reliable results. Moreover, the pressure for emphasizing significant results is not absolute. For example, the Proteus phenomenon 101 suggests that refuting early results can be attractive in fields in which data can be produced rapidly. Nevertheless, we should not assume that science is effectively or efficiently self-correcting 102 . There is now substantial evidence that a large proportion of the evidence reported in the scientific literature may be unreliable. Acknowledging this challenge is the first step towards addressing the problematic aspects of current scientific practices and identifying effective solutions.
The Collaborative Approach to Meta-Analysis and Review of Animal Data from Experimental Studies (CAMARADES) is a collaboration that aims to reduce bias and improve the quality of methods and reporting in animal research. To this end, CAMARADES provides a resource for data sharing, aims to provide a web-based stratified meta-analysis bioinformatics engine and acts as a repository for completed reviews.
Effect size
An effect size is a standardized measure that quantifies the size of the difference between two groups or the strength of an association between two variables. As standardized measures, effect sizes allow estimates from different studies to be compared directly and also to be combined in meta-analyses.
Excess significance
Excess significance is the phenomenon whereby the published literature has an excess of statistically significant results that are due to biases in reporting. Several mechanisms contribute to reporting bias, including study publication bias, where the results of statistically non-significant ('negative') studies are left unpublished; selective outcome reporting bias, where null results are omitted; and selective analysis bias, where data are analysed with different methods that favour 'positive' results.
Fixed and random effects
A fixed-effect meta-analysis assumes that the underlying effect is the same (that is, fixed) in all studies and that any variation is due to sampling errors. By contrast, a random-effect meta-analysis does not require this assumption and allows for heterogeneity between studies. A test of heterogeneity in between-study effects is often used to test the fixed-effect assumption.
Meta-analysis
Meta-analysis refers to statistical methods for contrasting and combining results from different studies to provide more powerful estimates of the true effect size as opposed to a less precise effect size derived from a single study.
Positive predictive value
The positive predictive value (PPV) is the probability that a 'positive' research finding reflects a true effect (that is, the finding is a true positive). This probability of a research finding reflecting a true effect depends on the prior probability of it being true (before doing the study), the statistical power of the study and the level of statistical significance.
Proteus phenomenon
The Proteus phenomenon refers to the situation in which the first published study is often the most biased towards an extreme result (the winner's curse). Subsequent replication studies tend to be less biased towards the extreme, often finding evidence of smaller effects or even contradicting the findings from the initial study.
Statistical power
The statistical power of a test is the probability that it will correctly reject the null hypothesis when the null hypothesis is false (that is, the probability of not committing a type II error or making a false negative decision). The probability of committing a type II error is referred to as the false negative rate (β), and power is equal to 1 − β.
Winner's curse
The winner's curse refers to the phenomenon whereby the 'lucky' scientist who makes a discovery is cursed by finding an inflated estimate of that effect. The winner's curse occurs when thresholds, such as statistical significance, are used to determine the presence of an effect and is most severe when thresholds are stringent and studies are too small and thus have low power.
Perform an a priori power calculation
Use the existing literature to estimate the size of effect you are looking for and design your study accordingly. If time or financial constraints mean your study is underpowered, make this clear and acknowledge this limitation (or limitations) in the interpretation of your results.
Disclose methods and findings transparently
If the intended analyses produce null findings and you move on to explore your data in other ways, say so. Null findings locked in file drawers bias the literature, whereas exploratory analyses are only useful and valid if you acknowledge the caveats and limitations.
Pre-register your study protocol and analysis plan
Pre-registration clarifies whether analyses are confirmatory or exploratory, encourages well-powered studies and reduces opportunities for non-transparent data mining and selective reporting. Various mechanisms for this exist (for example, the Open Science Framework).
Make study materials and data available
Making research materials available will improve the quality of studies aimed at replicating and extending research findings. Making raw data available will enhance opportunities for data aggregation and meta-analysis, and allow external checking of analyses and results.
Work collaboratively to increase power and replicate findings
Combining data increases the total sample size (and therefore power) while minimizing the labour and resource impact on any one contributor. Large-scale collaborative consortia in fields such as human genetic epidemiology have transformed the reliability of findings in these fields.
M.R.M. and K.S.B. are members of the UK Centre for Tobacco Control Studies, a UK Public Health Research Centre of Excellence. Funding from British Heart Foundation, Cancer Research UK, Economic and Social Research Council, Medical Research Council and the UK National Institute for Health Research, under the auspices of the UK Clinical Research Collaboration, is gratefully acknowledged. The authors are grateful to G. Lewis for his helpful comments.